Example05 / 09
格式互转——边表、邻接矩阵、稀疏矩阵、GraphML 与 JSON 的往返检查
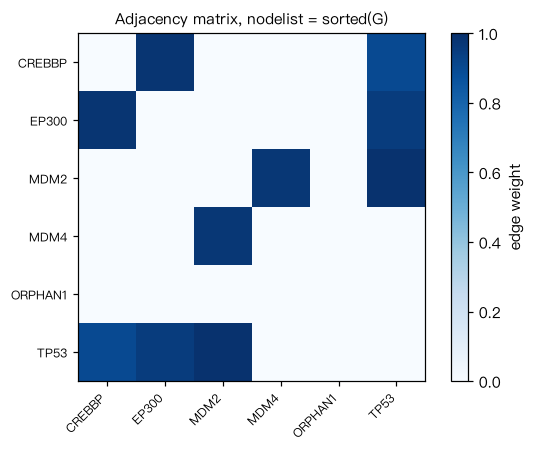
用同一个小网络演示五种表示之间的转换,并在每次转换后检查节点数、边数、权重与属性是否保留。 关键点:to_numpy_array / to_scipy_sparse_array 的行列顺序由 nodelist 决定,必须显式给出并保存; GraphML 只支持标量属性(字符串、数值、布尔),列表类属性要先转为字符串;读回时节点 id 一律是字符串。 输出:每种表示的规模、矩阵对称性、往返后边集是否一致。
Output输出图
Output文字输出
边表往返:5 节点 / 5 边(原图 6 节点,孤立点丢失)
稠密矩阵 (6, 6),对称:True;CSR 非零元 10(无向边各存两次)
稀疏矩阵往返边集一致:True
GraphML 往返:6 节点 / 5 边,TP53 的 role = 'tumor suppressor',权重类型 float
JSON 往返:6 节点 / 5 边
列表属性写 GraphML 失败:NetworkXError
转为分号分隔字符串后写入成功
Code代码
# 用同一个小网络演示五种表示之间的转换,并在每次转换后检查节点数、边数、权重与属性是否保留。
# 关键点:to_numpy_array / to_scipy_sparse_array 的行列顺序由 nodelist 决定,必须显式给出并保存;
# GraphML 只支持标量属性(字符串、数值、布尔),列表类属性要先转为字符串;读回时节点 id 一律是字符串。
# 输出:每种表示的规模、矩阵对称性、往返后边集是否一致。
import io, csv, json, tempfile, os
import numpy as np
import scipy.sparse as sp
import networkx as nx

G = nx.Graph()
G.add_weighted_edges_from([("TP53", "MDM2", 0.99), ("TP53", "EP300", 0.95), ("EP300", "CREBBP", 0.98),
                           ("MDM2", "MDM4", 0.97), ("CREBBP", "TP53", 0.90)])
G.add_node("ORPHAN1")                                    # 孤立点:边表里看不到它
nx.set_node_attributes(G, {"TP53": "tumor suppressor", "MDM2": "E3 ligase"}, "role")

# 1) 边表(CSV):孤立点会丢失,需要另存节点表
buf = io.StringIO()
w = csv.writer(buf); w.writerow(["source", "target", "weight"])
for u, v, d in G.edges(data=True):
    w.writerow([u, v, d["weight"]])
rows = list(csv.DictReader(io.StringIO(buf.getvalue())))
G_csv = nx.Graph((r["source"], r["target"], {"weight": float(r["weight"])}) for r in rows)
print("边表往返:%d 节点 / %d 边(原图 %d 节点,孤立点丢失)" % (
    G_csv.number_of_nodes(), G_csv.number_of_edges(), G.number_of_nodes()))

# 2) 稠密与稀疏邻接矩阵:显式固定节点顺序
nodes = sorted(G)
A = nx.to_numpy_array(G, nodelist=nodes, weight="weight")
S = nx.to_scipy_sparse_array(G, nodelist=nodes, weight="weight", format="csr")
print("稠密矩阵 %s,对称:%s;CSR 非零元 %d(无向边各存两次)" % (A.shape, np.allclose(A, A.T), S.nnz))
G_mat = nx.relabel_nodes(nx.from_scipy_sparse_array(S), dict(enumerate(nodes)))
print("稀疏矩阵往返边集一致:%s" % (set(map(frozenset, G_mat.edges())) == set(map(frozenset, G.edges()))))

# 3) GraphML:保留孤立点、权重和标量属性
tmp = tempfile.mkdtemp()
path = os.path.join(tmp, "g.graphml")
nx.write_graphml(G, path)
G_gml = nx.read_graphml(path)
print("GraphML 往返:%d 节点 / %d 边,TP53 的 role = %r,权重类型 %s" % (
    G_gml.number_of_nodes(), G_gml.number_of_edges(), G_gml.nodes["TP53"].get("role"),
    type(next(iter(G_gml.edges(data=True)))[2]["weight"]).__name__))

# 4) node-link JSON:适合网页可视化(如 D3.js)和保存任意可 JSON 化的属性
data = nx.node_link_data(G, edges="links")
G_json = nx.node_link_graph(json.loads(json.dumps(data)), edges="links")
print("JSON 往返:%d 节点 / %d 边" % (G_json.number_of_nodes(), G_json.number_of_edges()))

# 5) 列表属性写 GraphML 会报错,先转成字符串
G.nodes["TP53"]["pathways"] = ["p53 signaling", "apoptosis"]
try:
    nx.write_graphml(G, path)
except Exception as e:
    print("列表属性写 GraphML 失败:%s" % type(e).__name__)
G.nodes["TP53"]["pathways"] = ";".join(G.nodes["TP53"]["pathways"])
nx.write_graphml(G, path)
print("转为分号分隔字符串后写入成功")

# 作图:显式固定 nodelist 后的加权邻接矩阵(行列标签即矩阵顺序;孤立点为全零行列)
import matplotlib.pyplot as plt
fig, ax = plt.subplots(figsize=(5.4, 4.2))
im = ax.imshow(A, cmap="Blues", vmin=0, vmax=1)
ax.set_xticks(range(len(nodes))); ax.set_xticklabels(nodes, rotation=45, ha="right", fontsize=8)
ax.set_yticks(range(len(nodes))); ax.set_yticklabels(nodes, fontsize=8)
fig.colorbar(im, ax=ax, label="edge weight")
ax.set_title("Adjacency matrix, nodelist = sorted(G)", fontsize=10)
plt.tight_layout(); plt.show()Run在浏览器中运行
首次加载 Python 环境约需 20–40 秒;可以修改参数后重新运行。