Example02 / 11
从边列表构造邻接矩阵
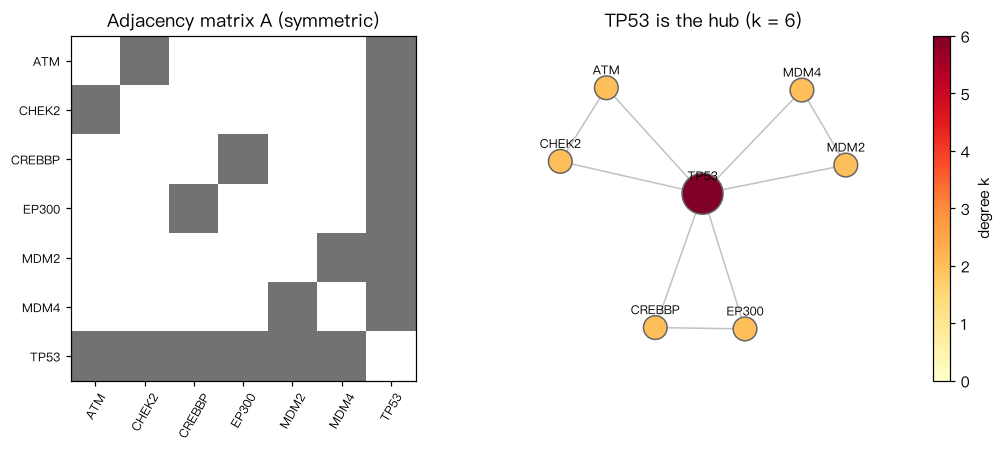
把一个玩具蛋白质相互作用网络的边列表转换为邻接矩阵 A(numpy 数组), 并验证无向图的三条基本性质:A 对称;度 = 行和;度之和 = 2 × 边数。 输出中 TP53 的度最大(与 6 个蛋白相连);最后用 NetworkX 核对度并计算网络密度。
Output输出图
Output文字输出
节点顺序: ['ATM', 'CHEK2', 'CREBBP', 'EP300', 'MDM2', 'MDM4', 'TP53']
[[0 1 0 0 0 0 1]
 [1 0 0 0 0 0 1]
 [0 0 0 1 0 0 1]
 [0 0 1 0 0 0 1]
 [0 0 0 0 0 1 1]
 [0 0 0 0 1 0 1]
 [1 1 1 1 1 1 0]]
对称吗? True
各节点的度: {'ATM': 2, 'CHEK2': 2, 'CREBBP': 2, 'EP300': 2, 'MDM2': 2, 'MDM4': 2, 'TP53': 6}
度之和 = 18, 2 × 边数 = 18
NetworkX 给出的度: {'TP53': 6, 'MDM2': 2, 'EP300': 2, 'MDM4': 2, 'CREBBP': 2, 'ATM': 2, 'CHEK2': 2}
网络密度 = 0.429Code代码
# 把一个玩具蛋白质相互作用网络的边列表转换为邻接矩阵 A(numpy 数组),
# 并验证无向图的三条基本性质:A 对称;度 = 行和;度之和 = 2 × 边数。
# 输出中 TP53 的度最大(与 6 个蛋白相连);最后用 NetworkX 核对度并计算网络密度。
import networkx as nx
import numpy as np

edges = [("TP53", "MDM2"), ("TP53", "EP300"), ("MDM2", "MDM4"), ("TP53", "MDM4"),
         ("EP300", "CREBBP"), ("TP53", "CREBBP"), ("ATM", "TP53"), ("ATM", "CHEK2"),
         ("CHEK2", "TP53")]
nodes = sorted({u for e in edges for u in e})
idx = {name: i for i, name in enumerate(nodes)}
N = len(nodes)

A = np.zeros((N, N), dtype=int)
for u, v in edges:
    A[idx[u], idx[v]] = A[idx[v], idx[u]] = 1

print("节点顺序:", nodes)
print(A)
print("对称吗?", np.array_equal(A, A.T))
deg = A.sum(axis=1)
print("各节点的度:", dict(zip(nodes, deg.tolist())))
print("度之和 = %d, 2 × 边数 = %d" % (deg.sum(), 2 * len(edges)))

G = nx.Graph(edges)
print("NetworkX 给出的度:", dict(G.degree()))
print("网络密度 = %.3f" % nx.density(G))

# 作图:左为邻接矩阵热图,右为网络布局(节点大小与颜色 ∝ 度)
import matplotlib.pyplot as plt

fig, (ax1, ax2) = plt.subplots(1, 2, figsize=(10, 4.2))
ax1.imshow(A, cmap="Greys", vmin=0, vmax=1.6)
ax1.set_xticks(range(N)); ax1.set_xticklabels(nodes, rotation=60, fontsize=8)
ax1.set_yticks(range(N)); ax1.set_yticklabels(nodes, fontsize=8)
ax1.set_title("Adjacency matrix A (symmetric)")
pos = nx.spring_layout(G, seed=2)
nx.draw_networkx_edges(G, pos, ax=ax2, edge_color="0.6", alpha=0.6)
nc = nx.draw_networkx_nodes(G, pos, ax=ax2, nodelist=nodes, node_size=[120 * d for d in deg],
                            node_color=deg, cmap="YlOrRd", vmin=0, edgecolors="0.4")
nx.draw_networkx_labels(G, {n: (x, y + 0.13) for n, (x, y) in pos.items()}, ax=ax2, font_size=8)
ax2.margins(0.15)
fig.colorbar(nc, ax=ax2, label="degree k")
ax2.set_title("TP53 is the hub (k = %d)" % deg.max()); ax2.axis("off")
plt.tight_layout(); plt.show()Run在浏览器中运行
首次加载 Python 环境约需 20–40 秒;可以修改参数后重新运行。