Example10 / 13
马尔可夫聚类(MCL)检测蛋白复合物并与参考复合物匹配
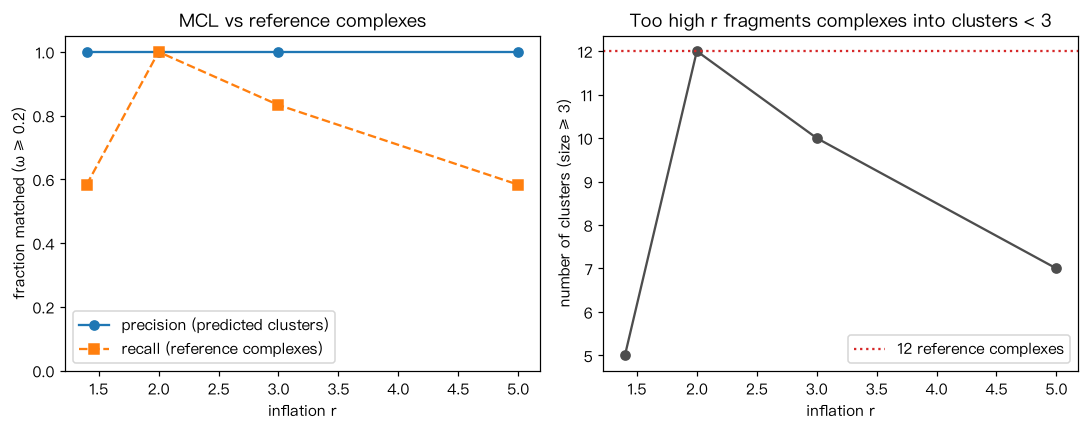
生成含 12 个“复合物”(每个 5–9 个蛋白,内部连边概率 0.7)的模拟 PPI 网络,并加入随机背景边。 MCL:对列随机化的邻接矩阵(加自环)反复做“扩张”(矩阵平方)与“膨胀”(逐元素 r 次幂后列归一化)。 用重叠分数 ω(P, R) = |P∩R|² / (|P|·|R|) 把预测簇与参考复合物匹配(阈值 0.2),报告精确率与召回率。 输出解读:膨胀参数 r 越大,簇越小越多;r 适中时预测簇与参考复合物匹配最好。
Output输出图
Output文字输出
膨胀 r = 1.4: 预测簇  5 个,精确率 = 1.00,召回率 = 0.58
膨胀 r = 2.0: 预测簇 12 个,精确率 = 1.00,召回率 = 1.00
膨胀 r = 3.0: 预测簇 10 个,精确率 = 1.00,召回率 = 0.83
膨胀 r = 5.0: 预测簇  7 个,精确率 = 1.00,召回率 = 0.58
Code代码
# 生成含 12 个“复合物”(每个 5–9 个蛋白,内部连边概率 0.7)的模拟 PPI 网络,并加入随机背景边。
# MCL:对列随机化的邻接矩阵(加自环)反复做“扩张”(矩阵平方)与“膨胀”(逐元素 r 次幂后列归一化)。
# 用重叠分数 ω(P, R) = |P∩R|² / (|P|·|R|) 把预测簇与参考复合物匹配(阈值 0.2),报告精确率与召回率。
# 输出解读:膨胀参数 r 越大,簇越小越多;r 适中时预测簇与参考复合物匹配最好。
import numpy as np
import networkx as nx

rng = np.random.default_rng(11)
ref, nodes = [], 0                                   # 模拟数据,仅用于演示方法
G = nx.Graph()
for _ in range(12):
    s = int(rng.integers(5, 10)); members = list(range(nodes, nodes + s)); nodes += s
    ref.append(set(members))
    G.add_nodes_from(members)
    G.add_edges_from((a, b) for i, a in enumerate(members) for b in members[i + 1:] if rng.random() < 0.7)
for _ in range(60):
    a, b = rng.integers(nodes, size=2)
    if a != b: G.add_edge(int(a), int(b))

def mcl(G, inflation=2.0, n_iter=60):
    nl = list(G.nodes()); M = nx.to_numpy_array(G, nodelist=nl) + np.eye(len(nl))
    M /= M.sum(0)
    for _ in range(n_iter):
        M = M @ M                                    # 扩张
        M = M ** inflation; M /= M.sum(0)            # 膨胀
    clusters = {}
    for j in range(len(nl)):                         # 每列归到其吸引子(最大值所在行)
        clusters.setdefault(int(np.argmax(M[:, j])), set()).add(nl[j])
    return [c for c in clusters.values() if len(c) >= 3]

def omega(P, R):
    return len(P & R) ** 2 / (len(P) * len(R))

rs, n_pred, precs, recs = [1.4, 2.0, 3.0, 5.0], [], [], []
for r in rs:
    pred = mcl(G, r)
    prec = np.mean([max(omega(P, R) for R in ref) >= 0.2 for P in pred]) if pred else 0
    rec = np.mean([max((omega(P, R) for P in pred), default=0) >= 0.2 for R in ref])
    print(f"膨胀 r = {r}: 预测簇 {len(pred):2d} 个,精确率 = {prec:.2f},召回率 = {rec:.2f}")
    n_pred.append(len(pred)); precs.append(prec); recs.append(rec)

import matplotlib.pyplot as plt
fig, ax = plt.subplots(1, 2, figsize=(10, 4))
ax[0].plot(rs, precs, "o-", label="precision (predicted clusters)")
ax[0].plot(rs, recs, "s--", label="recall (reference complexes)")
ax[0].set_ylim(0, 1.05); ax[0].set_xlabel("inflation r"); ax[0].set_ylabel("fraction matched (ω ≥ 0.2)")
ax[0].set_title("MCL vs reference complexes"); ax[0].legend()
ax[1].plot(rs, n_pred, "o-", color="0.3"); ax[1].axhline(len(ref), color="C3", ls=":", label="12 reference complexes")
ax[1].set_xlabel("inflation r"); ax[1].set_ylabel("number of clusters (size ≥ 3)")
ax[1].set_title("Too high r fragments complexes into clusters < 3"); ax[1].legend()
plt.tight_layout(); plt.show()Run在浏览器中运行
首次加载 Python 环境约需 20–40 秒;可以修改参数后重新运行。