Example01 / 07
疾病基因是否聚成模块(最大连通分支 + 度匹配随机基线)
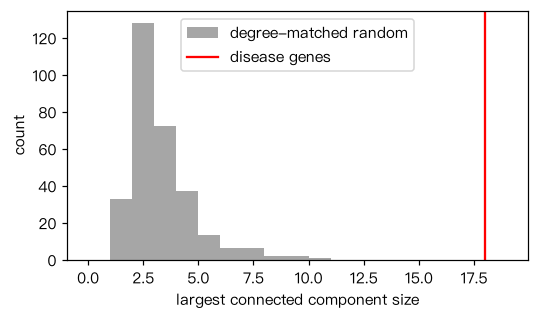
计算疾病基因诱导子图的最大连通分支(LCC)大小,与 300 组“度匹配”的随机基因集比较,得到 z 分数。 度匹配:把节点按度从小到大装箱(每箱至少 40 个节点),随机集合中每个基因都从原基因所在的度箱中无放回抽取。 输出解读:疾病基因的 LCC 明显大于随机期望(z 远大于 2),支持“疾病模块”。 若改为从全网均匀抽取随机基因,随机集合的度偏低、更难相连,z 会被人为抬高。
Output输出图
Output文字输出
观察 LCC = 18,度匹配随机期望 = 2.8 ± 1.5,z = 10.3,经验 p = 0.003
Code代码
# 计算疾病基因诱导子图的最大连通分支(LCC)大小,与 300 组“度匹配”的随机基因集比较,得到 z 分数。
# 度匹配:把节点按度从小到大装箱(每箱至少 40 个节点),随机集合中每个基因都从原基因所在的度箱中无放回抽取。
# 输出解读:疾病基因的 LCC 明显大于随机期望(z 远大于 2),支持“疾病模块”。
# 若改为从全网均匀抽取随机基因,随机集合的度偏低、更难相连,z 会被人为抬高。
import networkx as nx
import numpy as np
import matplotlib.pyplot as plt

def make_network(seed=14):
    G = nx.barabasi_albert_graph(1000, 2, seed=seed)
    rng = np.random.default_rng(seed)
    # 从一个中等度数的种子出发,每步把“与当前模块连边最多”的邻居之一加入,得到一个局部聚集的疾病模块
    start = int(rng.choice([n for n in G if 4 <= G.degree(n) <= 8]))
    module = {start}
    while len(module) < 25:
        frontier = {v for u in module for v in G[u]} - module
        score = {v: sum(1 for u in G[v] if u in module) for v in frontier}
        best = max(score.values())
        cand = sorted(v for v in frontier if score[v] == best)
        module.add(int(rng.choice(cand)))
    # 模拟“数据不完整”:随机丢掉模块中 5 个基因的身份(只知道 20 个疾病基因)
    known = sorted(rng.choice(sorted(module), size=20, replace=False).tolist())
    return G, known

def degree_bins(G, min_bin=40):
    """按度从小到大排列节点,相邻度值合并,直到每个箱至少有 min_bin 个节点。返回 节点 -> 箱内节点列表。"""
    by_deg = {}
    for n, d in G.degree():
        by_deg.setdefault(d, []).append(n)
    bins, cur = [], []
    for d in sorted(by_deg):
        cur += by_deg[d]
        if len(cur) >= min_bin:
            bins.append(cur); cur = []
    if cur:
        bins[-1] += cur
    return {n: b for b in bins for n in b}

def lcc_size(G, nodes):
    H = G.subgraph(nodes)
    return max(len(c) for c in nx.connected_components(H)) if len(H) else 0

def sample_matched(rng, nodes, node2bin):
    """为 nodes 中每个节点从其度箱中抽一个替身,整体不重复。"""
    chosen = set()
    for n in nodes:
        pool = [v for v in node2bin[n] if v not in chosen]
        chosen.add(int(rng.choice(pool)))
    return sorted(chosen)

G, disease = make_network()
node2bin = degree_bins(G)
rng = np.random.default_rng(0)

obs = lcc_size(G, disease)
rand_sizes = [lcc_size(G, sample_matched(rng, disease, node2bin)) for _ in range(300)]
mu, sd = np.mean(rand_sizes), np.std(rand_sizes)
p_emp = (1 + sum(s >= obs for s in rand_sizes)) / (len(rand_sizes) + 1)
print(f"观察 LCC = {obs},度匹配随机期望 = {mu:.1f} ± {sd:.1f},z = {(obs - mu) / sd:.1f},经验 p = {p_emp:.3f}")

plt.figure(figsize=(5, 3))
plt.hist(rand_sizes, bins=range(0, max(rand_sizes + [obs]) + 2), color="gray", alpha=0.7, label="degree-matched random")
plt.axvline(obs, color="r", label="disease genes")
plt.xlabel("largest connected component size"); plt.ylabel("count"); plt.legend(); plt.tight_layout(); plt.show()Run在浏览器中运行
首次加载 Python 环境约需 20–40 秒;可以修改参数后重新运行。