Example01 / 14
网络上的离散时间 SIR 模拟(ER 与 BA 网络对比)
每一步:每个感染者以概率 beta 感染每个易感邻居,然后以概率 gamma 恢复(移除)。 在节点数、平均度都相同的 ER 与 BA 网络上各做 30 次模拟(每次随机选 1 个种子), 比较平均最终感染规模(最终 R 的比例),并画出 BA 网络上的一条 S/I/R 曲线。 解读:同样的 beta、gamma 下,度异质的 BA 网络更容易暴发,平均最终规模更大。
Output输出图
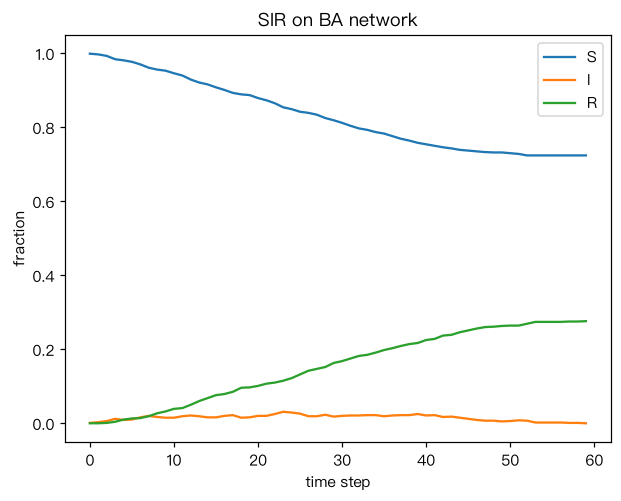
Output文字输出
ER 平均最终规模 = 0.006
BA 平均最终规模 = 0.062
Code代码
# 每一步:每个感染者以概率 beta 感染每个易感邻居,然后以概率 gamma 恢复(移除)。
# 在节点数、平均度都相同的 ER 与 BA 网络上各做 30 次模拟(每次随机选 1 个种子),
# 比较平均最终感染规模(最终 R 的比例),并画出 BA 网络上的一条 S/I/R 曲线。
# 解读:同样的 beta、gamma 下,度异质的 BA 网络更容易暴发,平均最终规模更大。
import numpy as np
import networkx as nx
import matplotlib.pyplot as plt

def sir(G, beta, gamma, seeds, rng, max_steps=500):
    """返回 (每一步的 S, I, R 比例数组, 最终移除比例)。"""
    n = G.number_of_nodes()
    nbrs = [list(G.neighbors(v)) for v in range(n)]
    state = np.zeros(n, dtype=int)          # 0=S, 1=I, 2=R
    state[list(seeds)] = 1
    hist = []
    for _ in range(max_steps):
        infected = np.flatnonzero(state == 1)
        hist.append([(state == 0).mean(), (state == 1).mean(), (state == 2).mean()])
        if infected.size == 0:
            break
        new_inf = set()
        for u in infected:
            for v in nbrs[u]:
                if state[v] == 0 and rng.random() < beta:
                    new_inf.add(v)
        recover = infected[rng.random(infected.size) < gamma]
        state[recover] = 2
        state[list(new_inf)] = 1
    return np.array(hist), (state == 2).mean()

N, m = 1000, 3
G_ba = nx.barabasi_albert_graph(N, m, seed=1)
G_er = nx.gnm_random_graph(N, G_ba.number_of_edges(), seed=1)
beta, gamma = 0.05, 0.3
rng = np.random.default_rng(0)

sizes_er = [sir(G_er, beta, gamma, [rng.integers(N)], rng)[1] for _ in range(30)]
sizes_ba = [sir(G_ba, beta, gamma, [rng.integers(N)], rng)[1] for _ in range(30)]
print("ER 平均最终规模 = %.3f" % np.mean(sizes_er))
print("BA 平均最终规模 = %.3f" % np.mean(sizes_ba))

hist, _ = sir(G_ba, beta, gamma, [0], np.random.default_rng(3))
plt.plot(hist[:, 0], label="S"); plt.plot(hist[:, 1], label="I"); plt.plot(hist[:, 2], label="R")
plt.xlabel("time step"); plt.ylabel("fraction"); plt.title("SIR on BA network"); plt.legend()
plt.show()Run在浏览器中运行
首次加载 Python 环境约需 20–40 秒;可以修改参数后重新运行。